One of the main questions all members of the crypto community are wondering about is when and how high will be the new bitcoin’s maximum. It is hard to give a clear answer as we are not psychics, but we can consider and provide a prediction. All we need is to discover bitcoin’s trajectory and learn more about factors that influence the coin.
Sounds challenging, but here is the good news: we’ve already calculated it!
Why everyone is so excited about bitcoin’s all-time high
Bitcoin (BTC) is the first and most capitalized cryptocurrency. Its rate moves in cycles. We can compare them with seasons:
🌱 spring — preparation for growth,
🌸 summer — active growth,
🍁 fall — decreasing after growth,
❄️ winter — price bottoming.
Bitcoin’s maximum (all-time high, ATH) is the highest ever price. It is always reached in a phase of active growth. BTC reaches a new ATH in approximately four years. The last maximum was $68.789 (November 2021).
Every ATH is displaced by a correction or price decrease. It may be assumed that BTC has already bottomed, which means the next will be the new growth cycle with a brand new all-time high. Market participants are highly involved in ATH tracking because they are interested in selling coins at the highest price, aiming to earn as much as possible.
According to the statistics, everyone who bought bitcoin three or more years ago got a profit. So coin’s owners who are now in loss may after some time get profit. The table below shows how bitcoin’s price has changed during the past nine years. Here is how to read it:
🕐 First column is a time period.
📈 Second column shows price changes in dollars for this period.
📊 Third column shows price changes in percent.
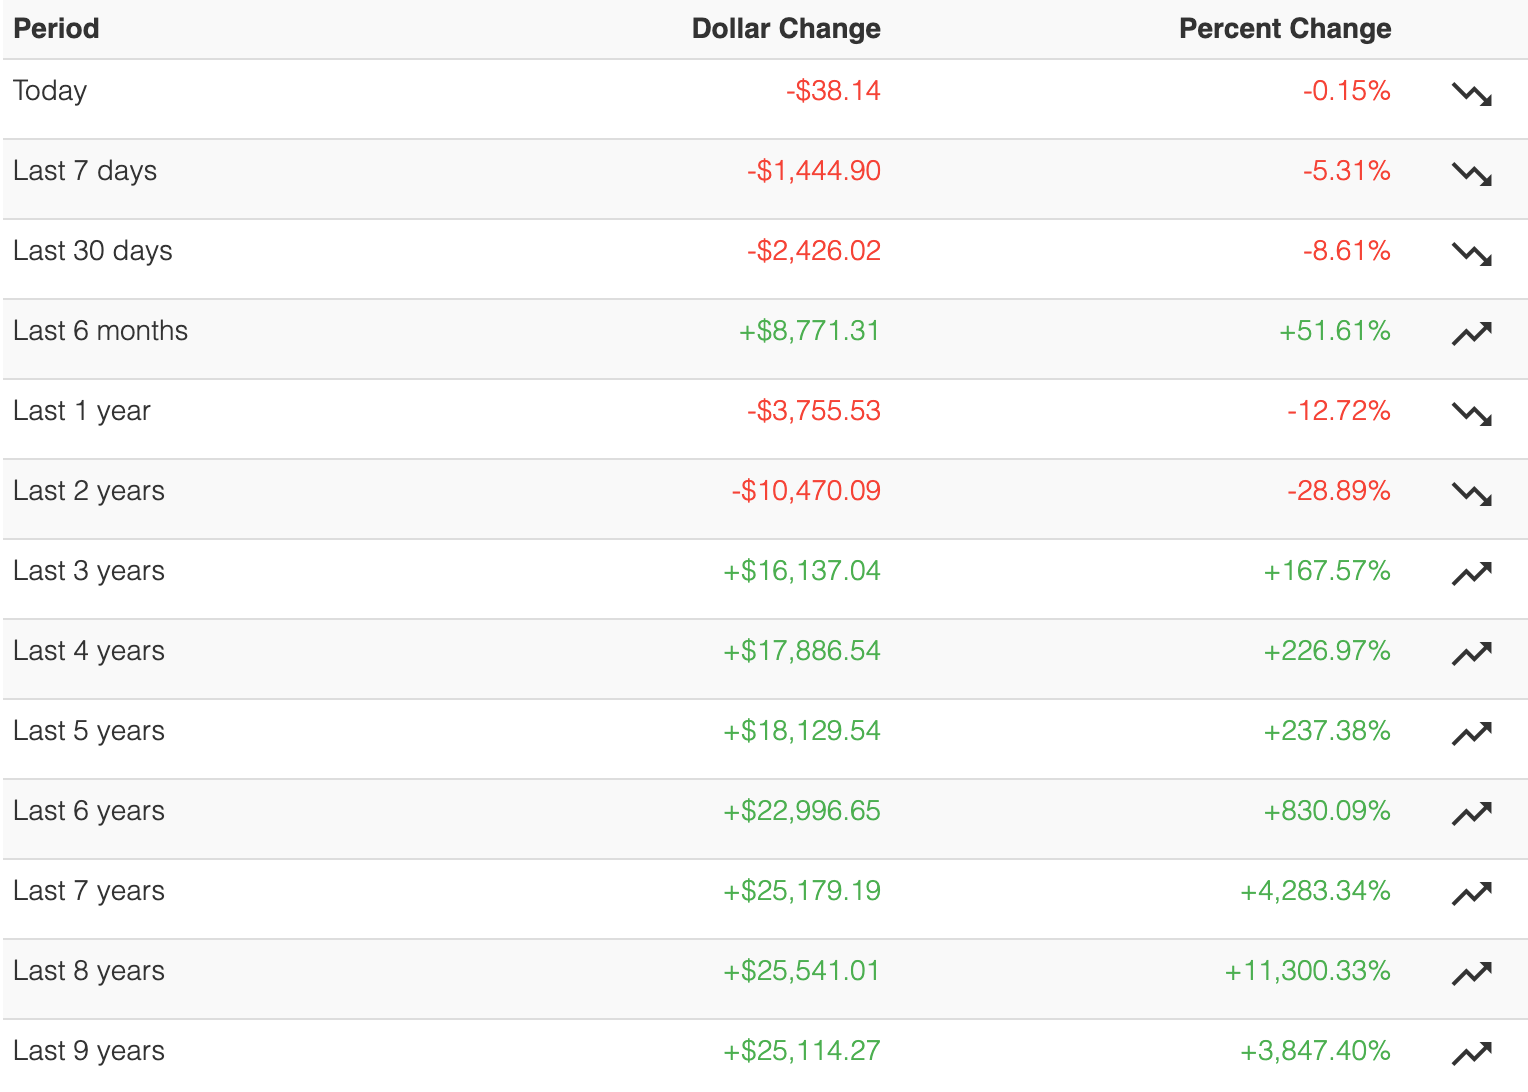
Over the past three years, Bitcoin has risen in price by $16 137, which is 167,5%. For comparison, over the past nine years BTC has grown by 3847%.
Factors that influence bitcoin
To understand bitcoin’s potential behavior, we should explore three main factors that influence its movements: halvings, world economics wellness, and the watchdog’s actions.
Halvings 🌗
Satoshi Nakamoto, an anonymous bitcoin inventor, wanted it to become an alternative for the traditional financial system, in which asset value depends on the watchdog’s actions. For example, the government can make a decision about printing new currency, which decreases money’s value. With bitcoin that’s impossible because the supply is limited by 21 million coins to be mined.
BTC flows on the market with the help of miners — market participants who extract coins. They provide the cryptocurrency network with computation power needed to execute transactions. Bitcoins are a reward miners receive for their work. This is how Bitcoin’s emission works. As of the moment of writing, every single mined block in bitcoin’s network brings miners 6,25 BTC.
Every 210K mined blocks (approximately once in four years), the network goes through a halving. It cuts mining speed in half, which means that miners' rewards become a half lower. After halving in 2024, it is going to be cut off at 3.125 BTC.
More than 19.3 million bitcoins have already been mined. The statistic shows stable crypto user inflow. At the same time, there are halvings that reduce the available coin amount. High demand plus lack of supply pushes the BTC price higher.
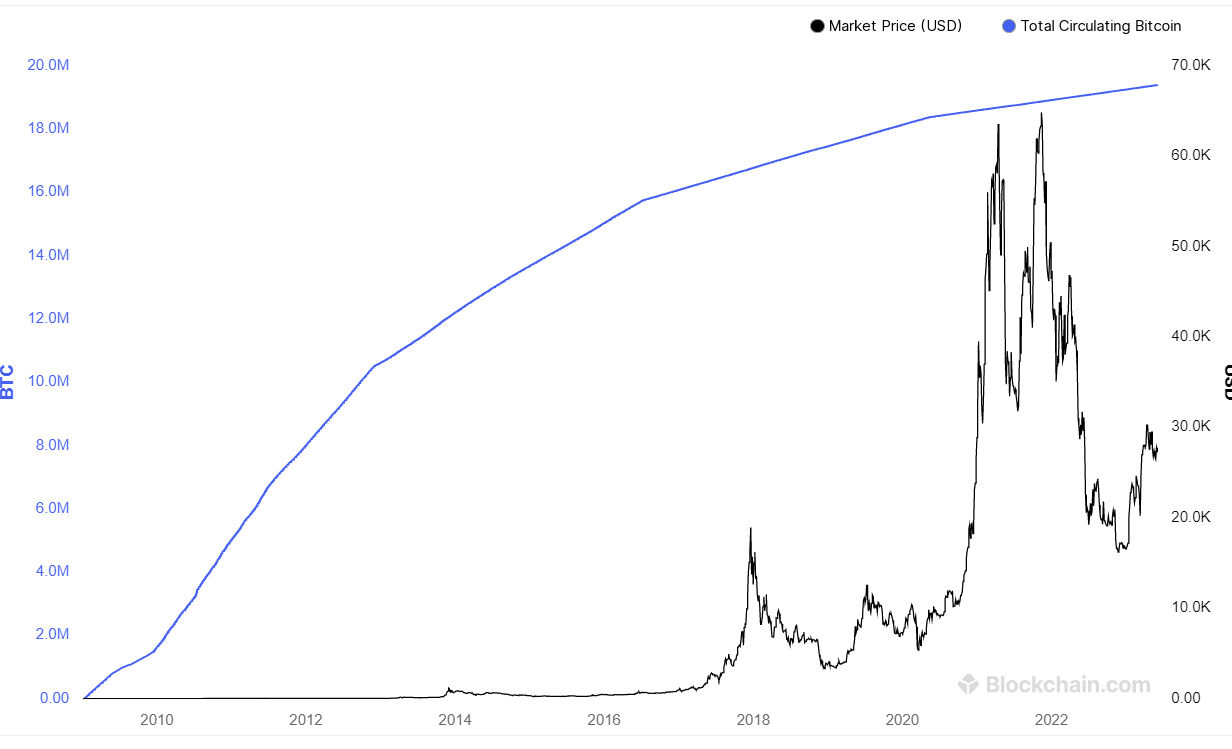
The chart shows BTC's (black curve) dependence to the amount of available coins (blue curve).
The easiest way to show bitcoin’s behavior patterns is a rainbow chart.

Here is how to read the chart:
🌈 Rainbow’s body helps to determine how close BTC is to the minimum (blue area) or maximum (red area) price tag. The black curve shows bitcoin’s price. According to the chart, bitcoin makes approximately one new ATH in four years.
🌈 Vertical blue lines are halving dates. Pay attention to Bitcoin’s reaction to them. Every time since the halving passed, BTC shows significant growth with ATH.
If there won’t be any significant changes in bitcoin’s network (for example, speed changes because of user’s inflow or outflow), the next halving may be conducted in April 2024. It can be assumed that soon after it BTC will have a new growth wave leading to a new ATH.
Now let’s explore BTC’s behavior after previous halvings.
Halving on November 28, 2012
📉 Bitcoin exchange rate on the day of halving: $12.
📈 ATH: $1240.
📊 Growth since halving till ATH: 10740%.
🗓️ How many days it took to reach ATH: 372.
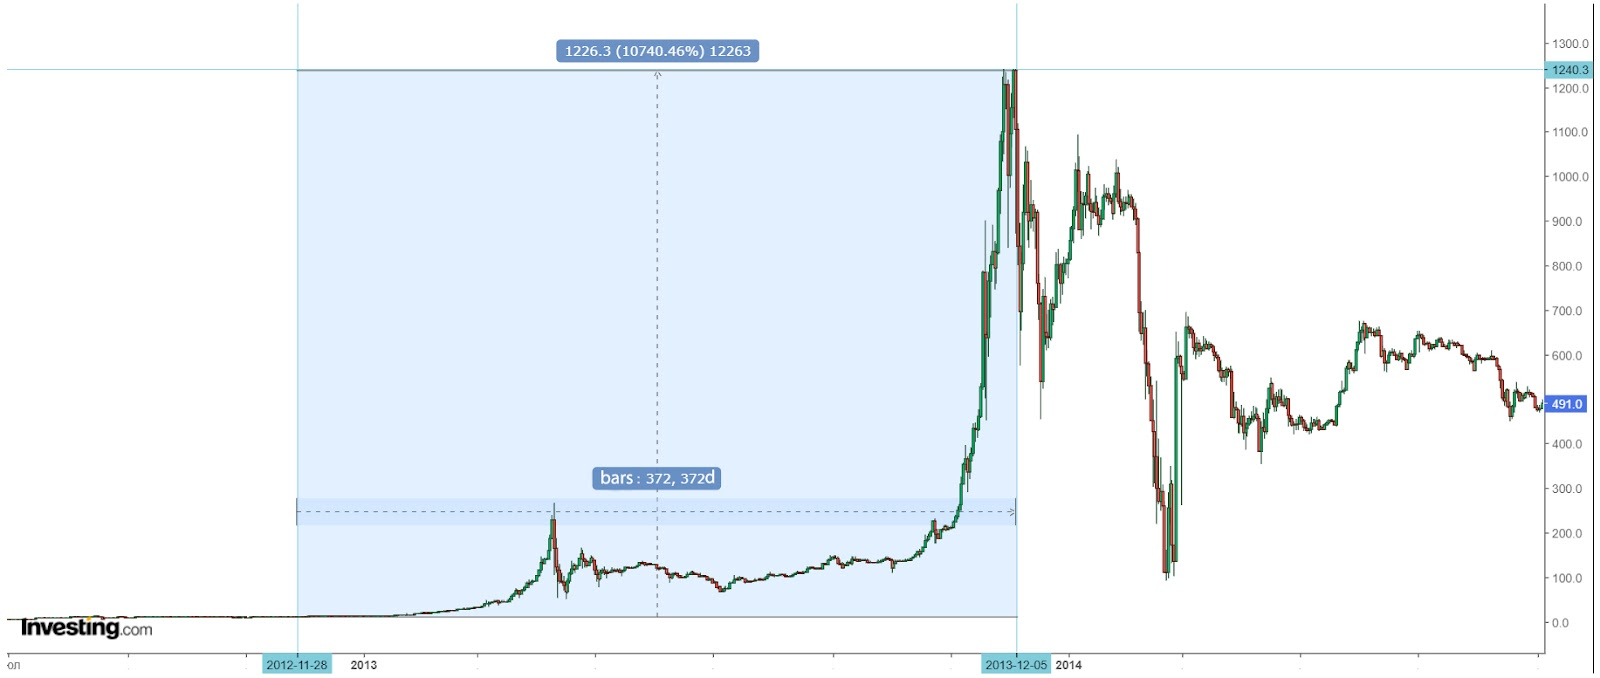
Bitcoin’s behavior after halving on November 28, 2012.
Halving on July 9, 2016
📉 Bitcoin exchange rate on the day of halving: $635.
📈 ATH: $19,849
📊 Growth since halving till ATH: 1490% (-86% in comparison with previous cycle).
🗓️ How many days it took to reach ATH: 526.
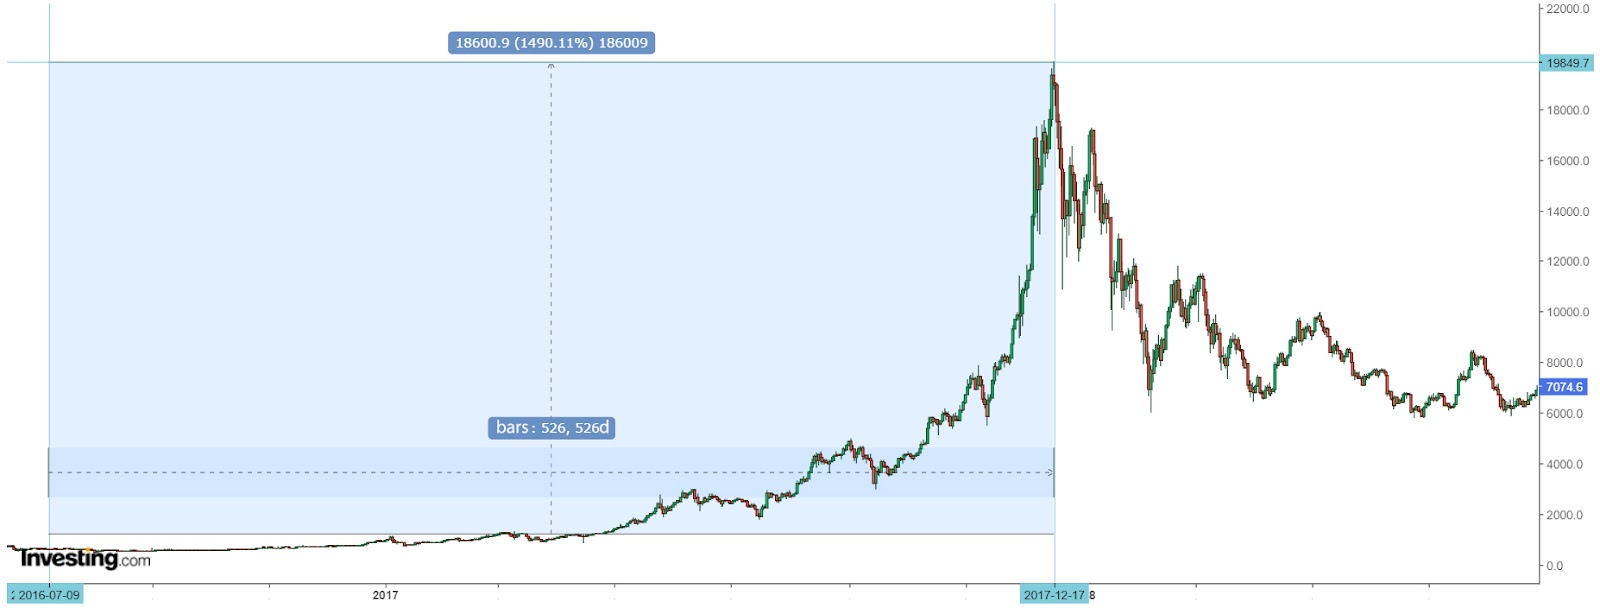
Bitcoin’s behavior after halving on July 9, 2016.
Halving on May 11, 2020
📉 Bitcoin exchange rate on the day of halving: $8627.
📈 ATH: $68 934.
📊 Growth since halving till ATH: 630 (-57% in comparison with previous cycle).
🗓️ How many days it took to reach ATH: 548.
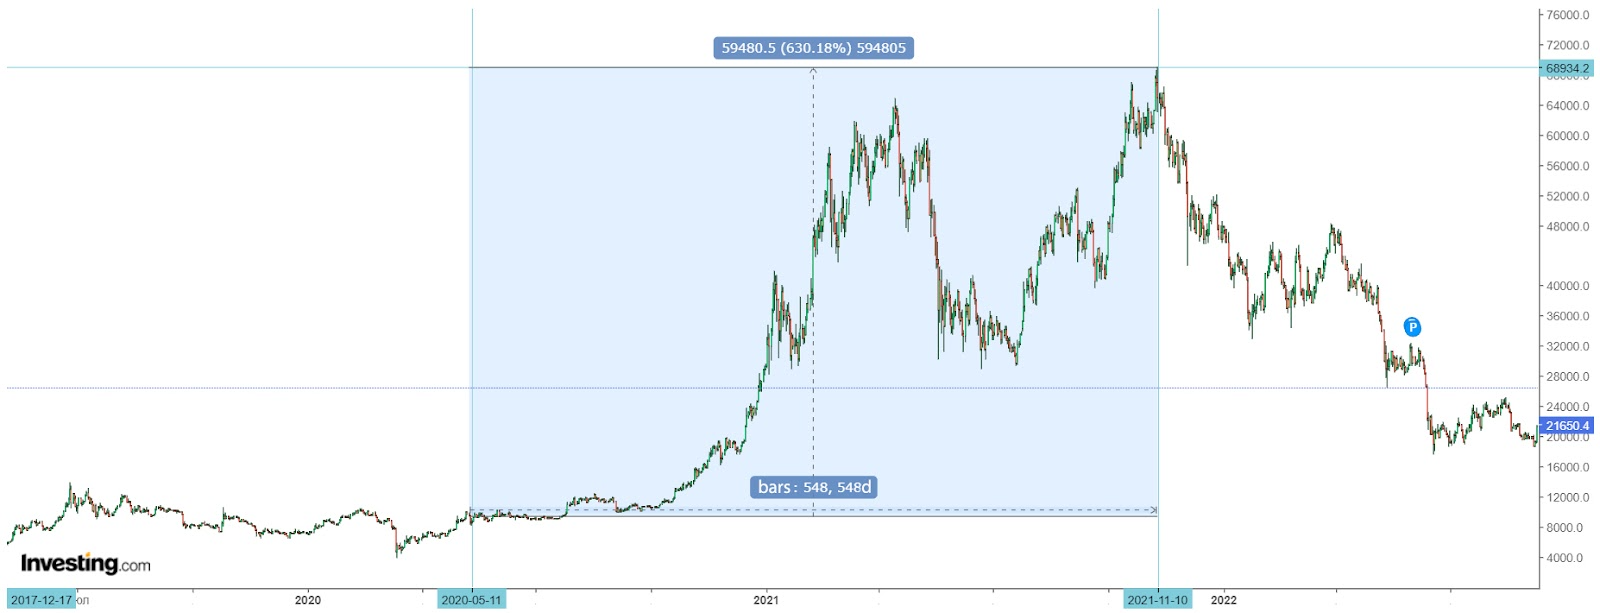
Bitcoin’s behavior after halving on May 11, 2020.
What’s important here:
📊 The scale of Bitcoin's growth from the halving date to ATH is declining. It can be assumed that the trend will continue. The average decrease is minus 71% (86+57/2). Accordingly, the next bitcoin ATH can be fixed at a height of +182% of the rate as of the 2024 halving date.
🗓️ On average, Bitcoin takes approximately 480 days to reach ATH after the halving. If the next BTC halving takes place at the end of April 2024, the next maximum will be at the end of August 2025.
World economic wellness 💰
The crypto market is not a closed ecosystem. It is related to the traditional financial market and its changes influence the crypto industry. We can find out more about outside and inside factors that influence bitcoin’s behavior through BTC’s curve comparison after every single halving. There are general dynamics, but a detailed study reveals discrepancies.
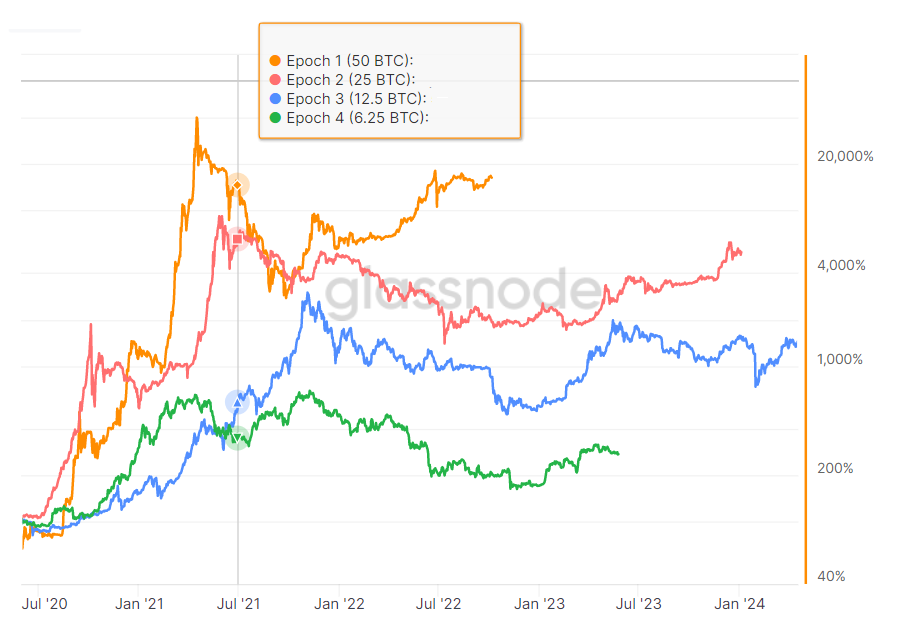
Bitcoin’s epoch comparison. The amount of BTC in brackets reflects the reward that miners received for mining one block. The scale with percentages on the right shows BTC growth.
1️⃣ The orange curve (epoch 1) shows the movement of bitcoin after the launch of the cryptocurrency network on January 3, 2009. That is the shortest epoch. The cryptocurrency network was searching for balance. Bitcoin than had few users, so even minor actions seriously affected the rate. But already in the first epoch, BTC outlined the approximate trajectory of movement after the halving — reaching the maximum with smooth decreasing.
2️⃣ The pink curve (epoch 2) shows Bitcoin movement after the first halving on November 28, 2012. Audience growth made it less susceptible to market fluctuations. Changes are also visible in a small growth, in comparison with the first era.
3️⃣ The blue Curve (epoch 3): Bitcoin movement after the July 9, 2016 halving. This era went through ICO hype and the launch of BTC futures, which brought institutional investors into the industry. The audience growth made the coin even more heavy and less volatile.
4️⃣ The green curve (epoch 4): Bitcoin movement after halving on May 11, 2020. At the beginning of 2021, BTC went through a series of shocks. First, the launch of sales of Tesla cars for bitcoins, which accompanied the coin rate growth. It was followed by Tesla's refusal to sell cars for cryptocurrency and the banishment of miners from China. Events brought down the course, but BTC managed to update ATH in November 2021.
The crypto market is related to the traditional economy. We can learn it from the bitcoin-fund market’s correlation. The last one’s health is highly dependent on the common global economy condition. The chart shows bitcoin and the fund market S&P 500 index, which reflects the 500 biggest US companies' securities correlation. Market participants usually use the S&P 500 to determine the whole fund market's health.
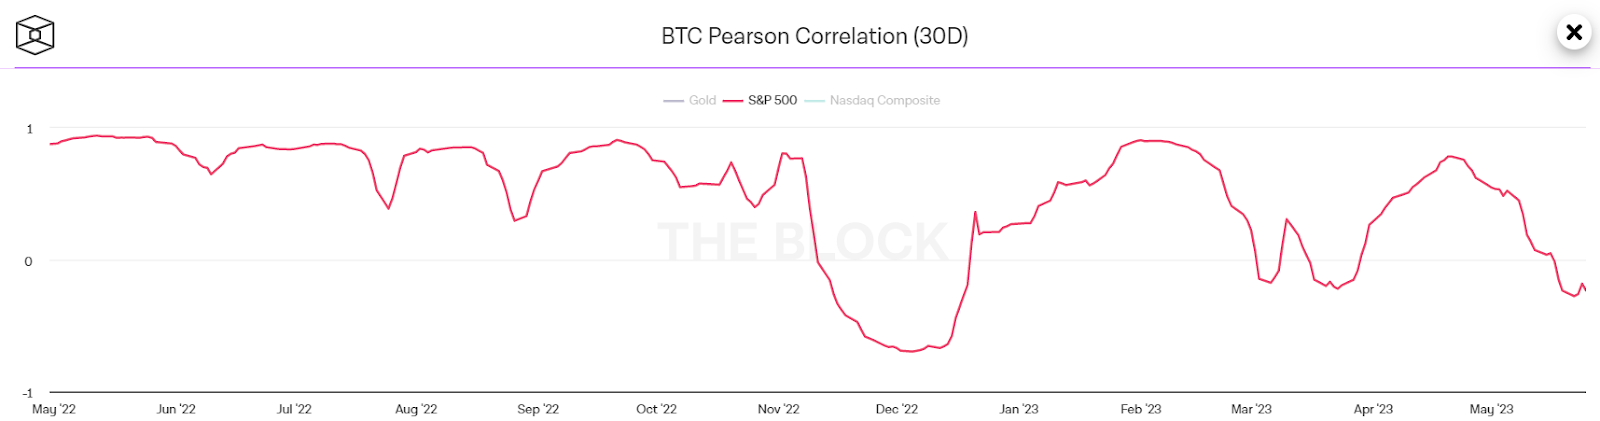
The curve approaching 1 (upside-left) means that bitcoin is quite identical to the index’s movements. A curve falling below zero determines a lack of correlation between BTC and the S&P 500.
During the crisis, people prefer to keep their money in trusted assets like gold, which is being called the currency of fear. Investments in cryptocurrency that have had no time to prove their reliability take the back seat.
The COVID crisis, which smoothly leaked into the economic crisis while sharpening the situation in the geopolitical area, provoked worldwide inflation growth. Watchdogs started fighting against changes through rate hikes. High rates mean expensive loans, company bankruptcies, and other unpleasant things that lead to economic reduction.
During such periods, investors’ attention is drawn to the world's biggest economies, such as the US. The whole 2022 regulators were increasing the rate. It may be assumed that in May, the market saw the last hike. Additional rate increases refusal may be a signal for a possible decrease soon. Changes may support the whole financial market, including the crypto industry.
Regulation 🧑⚖️
The US is the biggest economy and the main crypto community center. During 2022-2023, local watchdogs increased pressure on the crypto industry. US presidential candidate and current Miami mayor Ron DeSantis believes that four more years of such regulation of the crypto industry could destroy bitcoin.
Because of the enormous pressure, many crypto projects are searching for a new home in other countries. The good news is that the crypto community is familiar with this migration process. Because of the Chinese government's pressure in May 2021, a lot of miners found a new home in the US. Bitcoin lost about 50% of its value. Anyway, pressure never stopped BTC from reaching a new ATH several months later, in November 2021.
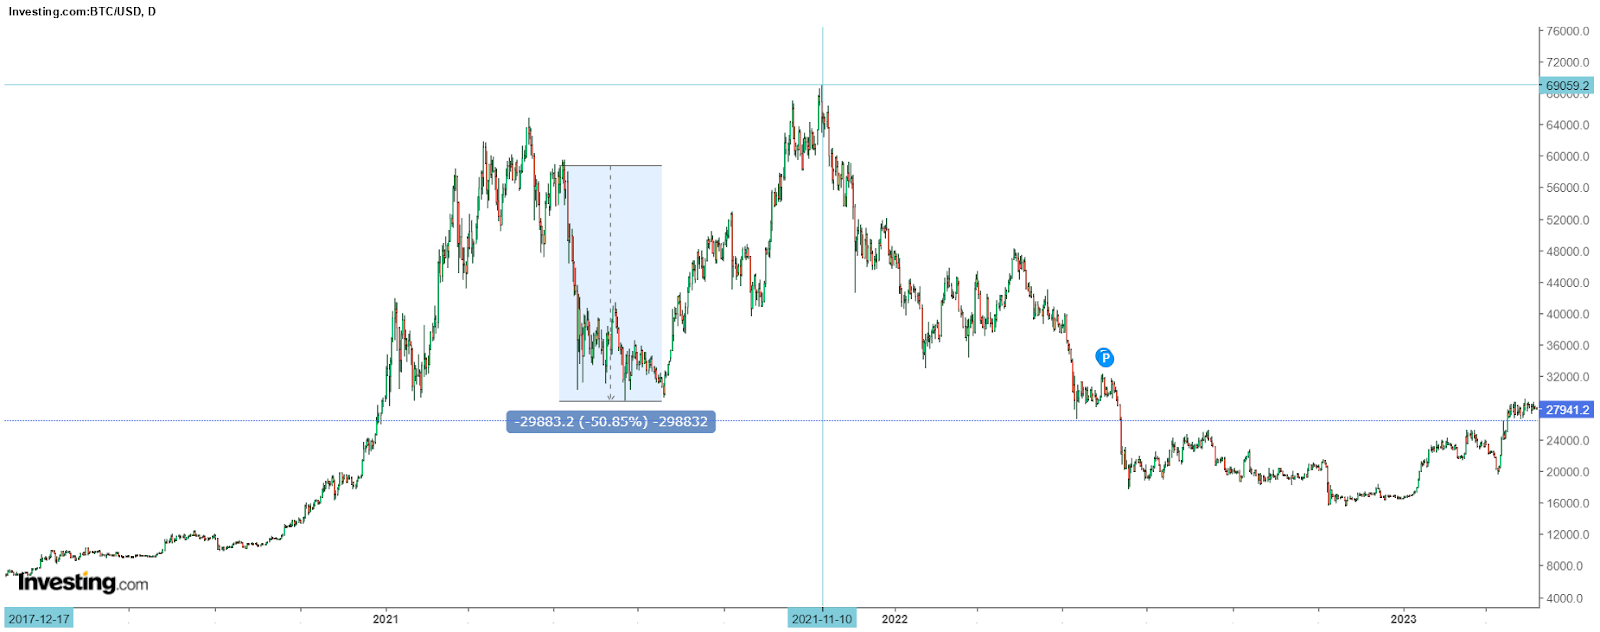
Bitcoin’s reaction to Chinese government actions against miners in May 2021.
Now in reverse mode, miners are falling under pressure in the US and searching for an opportunity to run back home in Asia, but we’ll talk about this process somewhere later. Even if there is another market redistribution due to tighter cryptocurrency regulation, BTC, as history shows, will be able to update ATH. But such problems greatly reduce the possibility of growth.
Bitcoin’s possible new ATH
Let’s collect some of the main details:
📈 Bitcoin’s possible growth since halving until ATH may be about +182%.
🗓️ The next bitcoin ATH may occur in August 2025.
💪 It may be assumed that the financial market may become stronger up to the next bitcoin halving in spring 2024 and that the sharpest phase of the crisis with rate hikes is already in the past.
😢 Bitcoin’s growth may be reduced by the watchdog’s pressure and possible market migration.
Now we need to find out the possible rate where bitcoin can meet halving in 2024. In order to do that, we should observe the rainbow chart again. It shows the possibility of BTC meeting next halving in a blue zone — somewhere close to $30K.
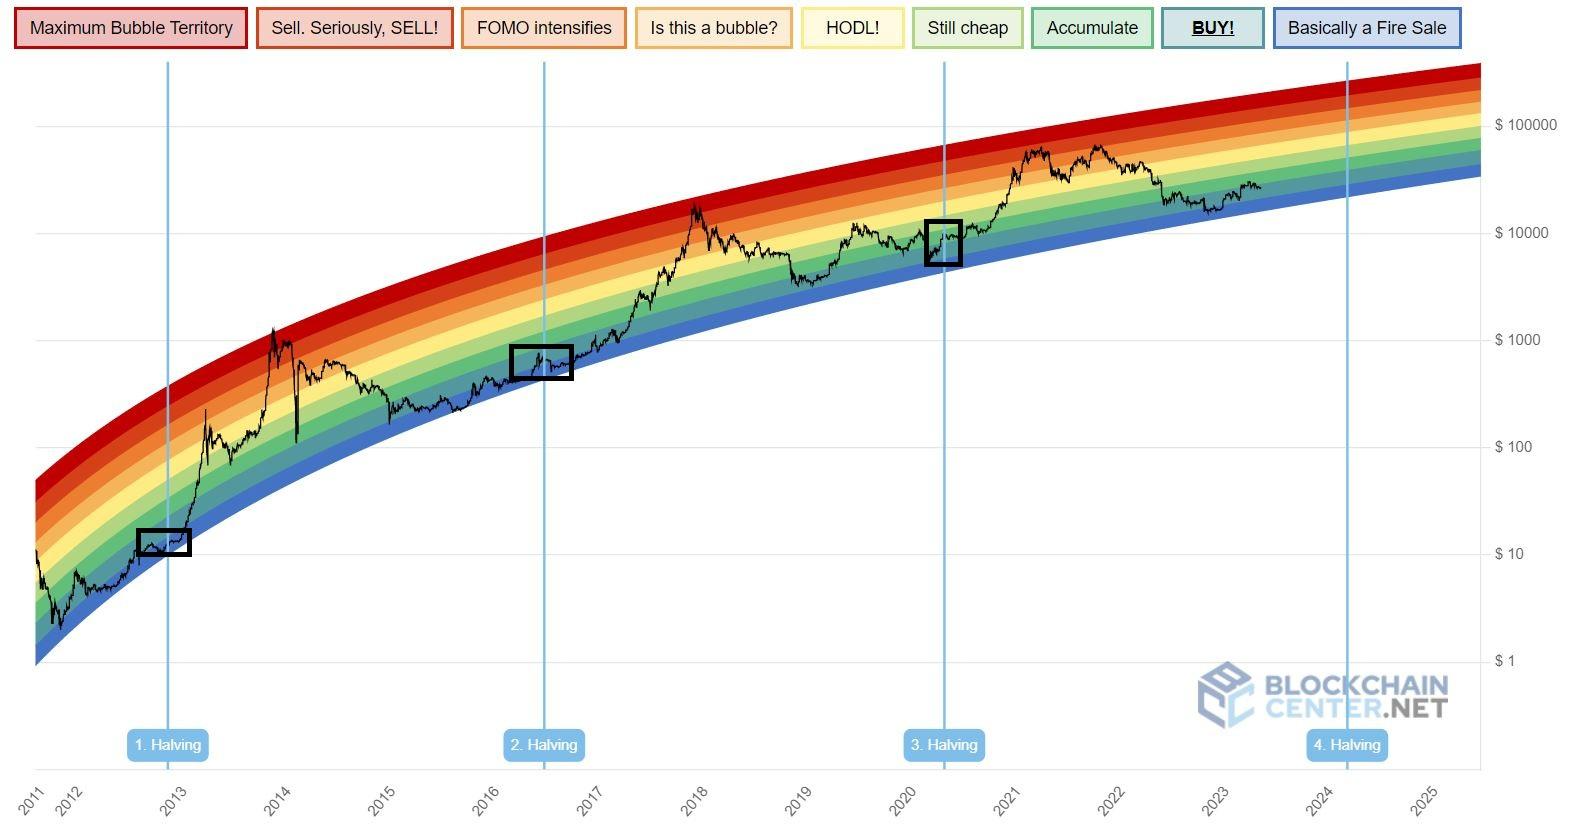
$30,000 plus 182% of possible growth makes $84 600. The watchdog’s pressure may reduce the final result. Prosperous geopolitical circumstances, on the opposite, as well as regulatory problem solving may increase numbers.
Many members of the crypto community believe that bitcoin’s ATH can be much higher. For example, Carl Runefelt (TheMoonCarl) bet on $270K per BTC in February 2025. Stock-to-flow bitcoin’s price prediction model author PlanB sees opportunity for $800K per bitcoin after halving in 2024.
🤔 Which prediction, as you believe, looks the most realistic? Tell us in our socials!
💌 Telegram, Instagram, Twitter, Facebook
This article is not an investment recommendation. The financial transactions mentioned in the article are not a guide to action. Itez is not responsible for possible risks. The user should independently conduct an analysis on the basis of which it will be possible to draw conclusions and make decisions about making any operations with cryptocurrency.