Every year more and more people become interested in cryptocurrencies. Some become investors in order to receive long-term income, while others become traders. Of course, anyone can trade, but at first, the profit will be zero, and sometimes minus.
To become a good trader, you need to learn and practice. It is surprising that with all possible risks the number of people interested in trading is not decreasing, but on the contrary growing. In this article we will tell you about all the pros and cons of crypto-trading and explain how to start earning.
Crypto trader profession specifics
Crypto trading is making money on the fluctuations of cryptocurrencies. The main goal is to buy a digital coin as cheaply as possible and then sell it as expensive as possible. The price difference is the trader's profit.
Trading on a crypto exchange differs from trading on the stock market. Most traders, both beginners and experienced professionals, dream of millions of dollars in returns. But this is impossible on the stock market as stocks grow 1% a day on average. However on the cryptocurrency market the average growth of even popular coins can be 3-4%, so the earning potential is higher.
What does it mean to be a crypto trader and what opportunities does it give?
🌴 Work without being tied to any location. A trader can work from anywhere in the world where there is Internet. In 2023, remote work is no longer unusual, but is really convenient.
⏰ The ability to plan your schedule by yourself. A trader is their own boss. Some traders work at night and have rest during the day, others trade a few hours a day and devote the rest of the time to family or their favorite hobby.
💰 Potentially high income. Cryptocurrency rates can change by tens of percent per day, which means that your capital can increase significantly every day. A profitability of 10-15% to your total capital per month is quite real. Also, crypto trading has a low entry threshold: the first deposit can even be $10.
Choosing a trading platform
Now let's move on to choosing the crypto exchange where we will trade and considering the most convenient ways to deposit. Here are the top-10 exchanges according to CoinMarketCap:

You can buy coins directly on the exchange. The most popular and convenient options are Binance, Kraken, KuCoin and Bybit.
There is a more profitable, simple and fast way to buy cryptocurrencies: with the help of on-ramp services. They allow you to buy cryptocurrency for fiat directly from your bank card. For example, you can do it with itez platform. The service has a license from the Estonian regulator, so all transactions are absolutely legal and transparent. And now itez allows you to verify your identity through a residence permit.
Coins can be immediately sent to the exchange with which you will be trading. You just need to copy the address of the wallet in your personal account on the exchange and then specify it when buying cryptocurrency.

Choosing coins for trading
If you're a novice trader, it's best to start trading reliable cryptocurrencies. Those can be the top-10 coins according to CoinMarketCap:

All of them have been on the cryptocurrency market for years and have large trading volumes, which means that they cannot collapse by tens of percent in a day. And for comfortable work with popular coins, there are always market makers on the exchange, which also save from depreciation.
There is a myth that market makers don't help ordinary traders, but only drive them into losses, but that's not true. We have a detailed article about it.
If you start trading unpopular or new coins with unclear origin and bad reputation, there is a high probability that in one trading day their price will collapse by 99% and they will cease to exist. Partially, beginning traders can protect themselves from this by using the popular crypto exchanges we talked about earlier as reputable platforms do not add coins that have not proven to be reliable.
Another advantage of these top-10 coins is that even if they drop, they are very likely to grow and still bring profit in the near future.
Analysis of price levels
Before you start trading, it's important to understand the specifics of how coins move. Every coin moves from one price level to the next. Coins rate constantly goes up and down because of the actions of market participants. When the demand for a coin goes up, the price goes up. When the demand goes down, the price goes down as well.
There are so-called strong price levels, which make it difficult for the exchange rate to keep going in the same direction once reached. Strong price levels, which were difficult to pass, can be seen on the BNB chart for 2022:

In this case they are $444, $334, $300 and $261 (these levels are marked on the screenshot with blue horizontal lines). As we can see, in most cases, when the rate reaches these levels, it simply reverses and goes in the opposite direction.
Round numbers
At first, the price movement may seem chaotic, but if you watch the charts regularly, you will notice certain patterns. Often prices are reversed near round levels (numbers ending with one or more zeros, such as 10, 100, 260, 300, 1000, etc.). This is how human psychology works: we like to round. When we see a rounded price after a rate change, we consider that it's now acceptable to buy coins.
The important thing here is that a strong decline to the round level can be followed by a price rise. The likelihood of that happens when the price has reversed from that level before. To work with trading strategies, this understanding of price movement will come in handy.
Japanese Candlesticks
Now let's move on to the "hieroglyphs" on the chart. The green and red vertical sticks are the so-called Japanese candlesticks. They are very useful for showing the price movement.
This is what a candlestick consists of:
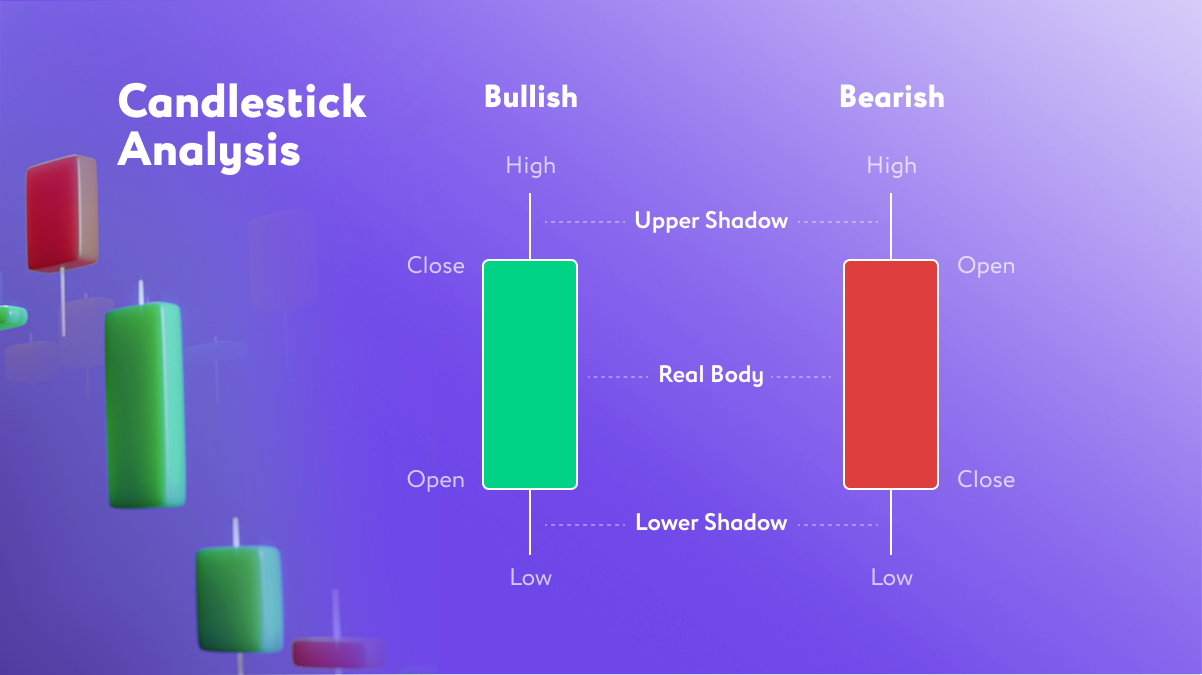
Each candlestick is formed over a certain period of time: 1 day, 1 hour, or even 1 minute. The smaller the time frame the candle means, the shorter it is. The longer the candle, the longer the price rose or fell. A green candlestick means the price was rising, and a red candlestick means it was falling.
Candlesticks are a convenient guide on the charts: lately, it will help you determine whether the price can go in the same direction as it went before, or if it will reverse.
For a successful trading according to our strategy, which we will soon practically analyze, let us study one more way of finding price levels, which will be a good addition to everything we have already discussed.
Fibonacci levels
Before we learn how to build Fibonacci levels, let's dig into history.
The Fibonacci sequence itself appeared in ancient India, where it was used in verse composition. European mathematician of the XII century Leonardo of Pisa, better known as Fibonacci, studied and described this sequence in detail in his work "Liber Abaci". This sequence is an infinite series of numbers, each next member of which is equal to the sum of the previous two: 0, 1, 1, 2, 3, 5, 8, 13, 21, 34, 55…
This sequence has many mathematical features, but the main one is that the ratio of each member to the previous one tends to the famous golden ratio – the number 1.618.
The golden ratio is the most harmonious proportion of the ratio of the whole to the part. The number 1.618 is often found in natural forms that have nothing directly in common with each other. This proportion can be seen in snail shells, in the distance between leaves on a tree branch, in the shape of galactic spirals and even in the average ratio of human body parts. And it is this ratio that is often found in trading!

In trading, we can find the golden ratio rule on the chart in the form of price levels. The thing is that market participants need price points to understand if it is profitable to buy now, or it is time to sell, and where the price can change its direction. But it is not always possible to determine precisely on which level the price will definitely reverse, and which one the price will not even notice. This is exactly the problem Fibonacci levels help to solve.
Here are the main Fibonacci correction levels: 0.618; 0.5; 0.382; 0.236. These numbers are connected by the "golden proportion", i.e., by the coefficient 0.618: starting from the 4th term, each previous number is 0.618 times less than the next one. If any member of the Fibo sequence is divided not by the next number, but by the number through one, we get the ratio approximating 0.382. And if you take the third member of the sequence after the initial one, the ratio between them will be approximately 0.236.
At first it seems complicated, but we don't need to interpret the underlying philosophical meaning of these values. It is enough to rely on the experience of traders and see how these numbers help to determine price levels.
Let's try to find strong price levels on the chart together. We will use tradingview. We drag the Fib retracement from the end of the trend to its beginning, i.e. from the lower left corner to the upper right corner (this tool works only in an uptrend, i.e. the general direction should be upwards):
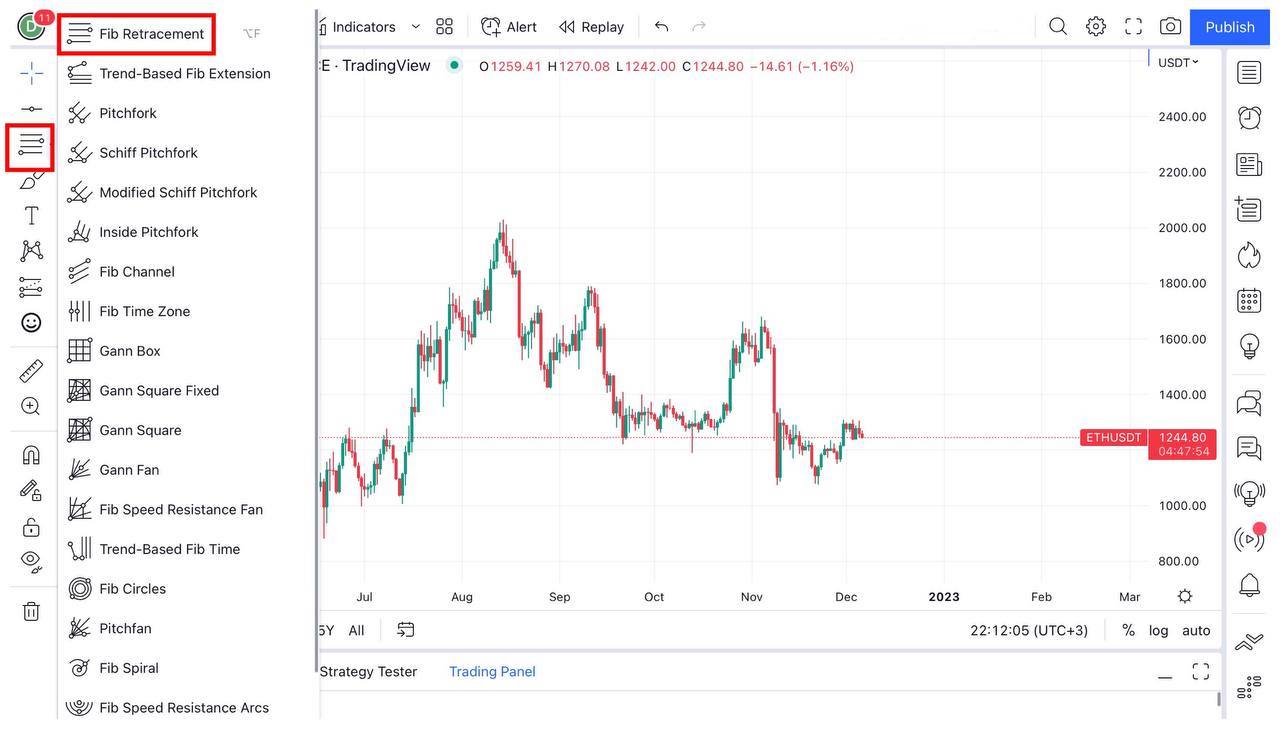
If we drag the Fibonacci retracement in this way, the resulting levels will become possible targets for a reverse of the course. It is from these levels we can enter the trend: they allow us to understand what will happen to the price next. Let's see how it looks at the rate of ETH to USDT. Let's select this instrument and drag it from the lower left corner to the upper right corner.
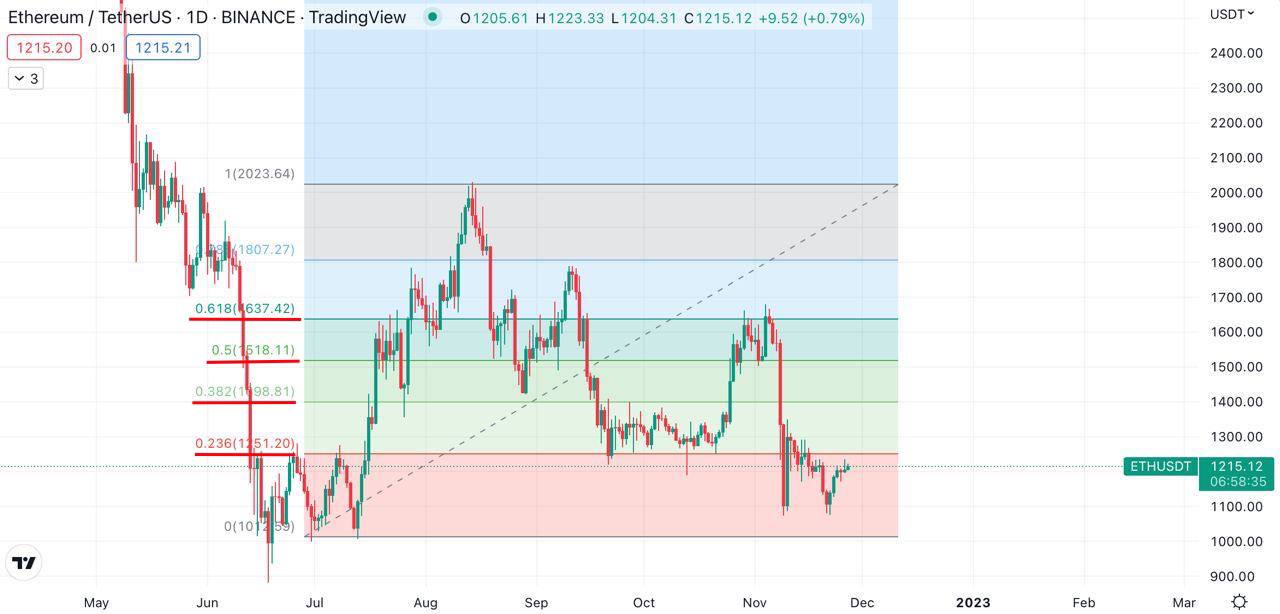
Look at how clearly the levels of 0.236; 0.382; 0.5; 0.618 (left of the "Fibonacci retracement" on the picture) work. The price reverses on most of these levels, which means it has an opportunity to earn good interest.
It is important to note that the price reverses after the fall and approaches a strong level where there are buyers who want to push the rate up. It means that we are looking for places on the chart where there are already other traders in order to buy an asset with them, the price of which will later move up due to high demand.
Finding strong price levels on which price will reverse is very important to trade successfully. If you find a wrong level, the price can skip it and go further down, bringing losses. But if you look for and draw levels on 3-4 coin charts every day, in a month you will be able to identify the most important levels with ease.
So, we have learned how to find strong price levels and how the Fibonacci retracements can help with it. Now it's time to put this knowledge into practice!
Ladder strategy
This strategy combines the manual drawing of price levels on the chart with the usage of Fibonacci retracement. The idea is that the Fibonacci levels match the levels we draw manually: that way the importance of each level increases, because two tools are pointing at it. It means that the chance that the price will reverse there increases as well.
Let's see how it looks on the chart. We will work with the BNB/USDT chart. Let's start by drawing price levels manually. Recall: the important levels for us are those where the price has often reversed.
We will draw them using the tradingview service and the «horizontal line» tool.

Having built the levels, we get the following graph:

The important targets for price correction for us are the levels of $300.5; $276.6 and $261.5, since the price most often reversed on them. Now let's apply the Fibonacci correction to the chart.
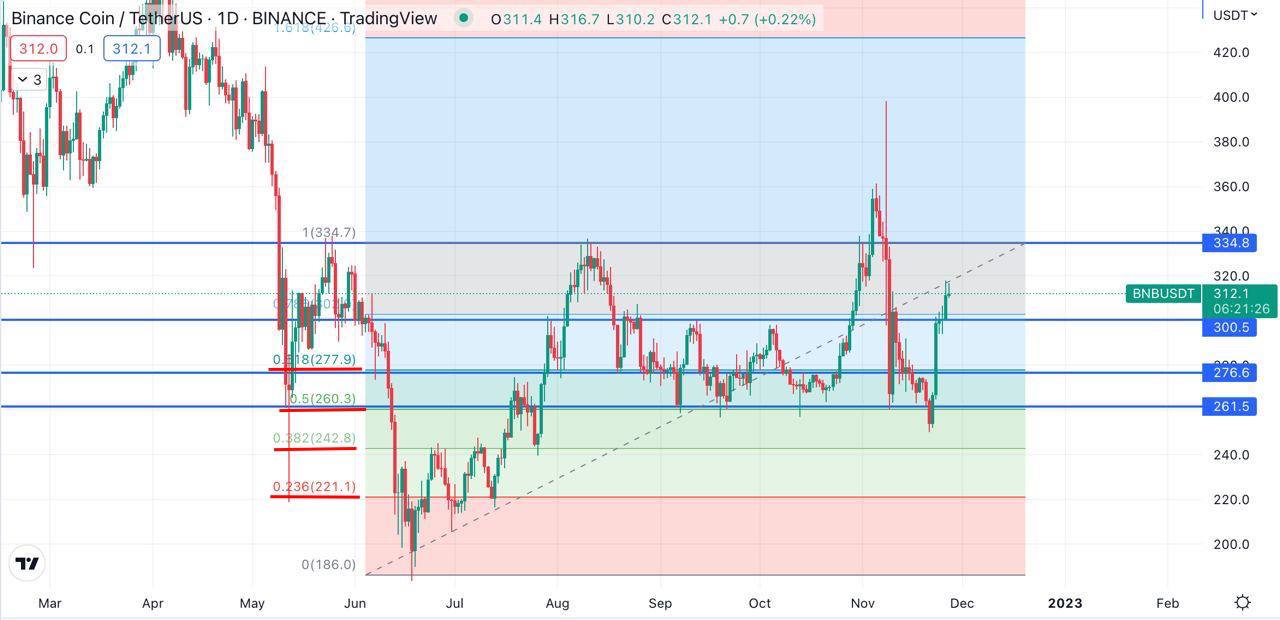
Look at how perfectly the 0.618 and 0.5 levels (on the left) match up with the $300.5 and $261.5 levels (on the right). It is on them that the price reversed, allowing traders to take interest.
Now let's move directly to the Ladder strategy. It implies a gradual gainind of positions when the price falls. If the price continues to drop, we additionally buy coins. Thus, the average purchase price becomes cheaper, which means the opportunity to earn more at the subsequent growth increases.
On the chart the blue lines show entry levels of the deal (276.6; 261.5; 242.5), and the red lines show exit levels (303.8; 273.9; 259).

Without the Fibonacci correction, the chart looks like this:

That is how do we act when open and close trades:
1️⃣ For the first entry into the trade (upper blue line, 276.6), we allocate 5% of the account (for example, having $1000 in the account, we buy BNB for $50 when the price per coin is $276.6);
2️⃣ For the second entry into the trade (middle blue line, $261.5) we allocate 7%;
3️⃣ For the third one (bottom blue line, $242.5) it is 8%.
As a result, in this strategy we allocate 20% of the account to buy coins. Let's see how it looks like in practice.
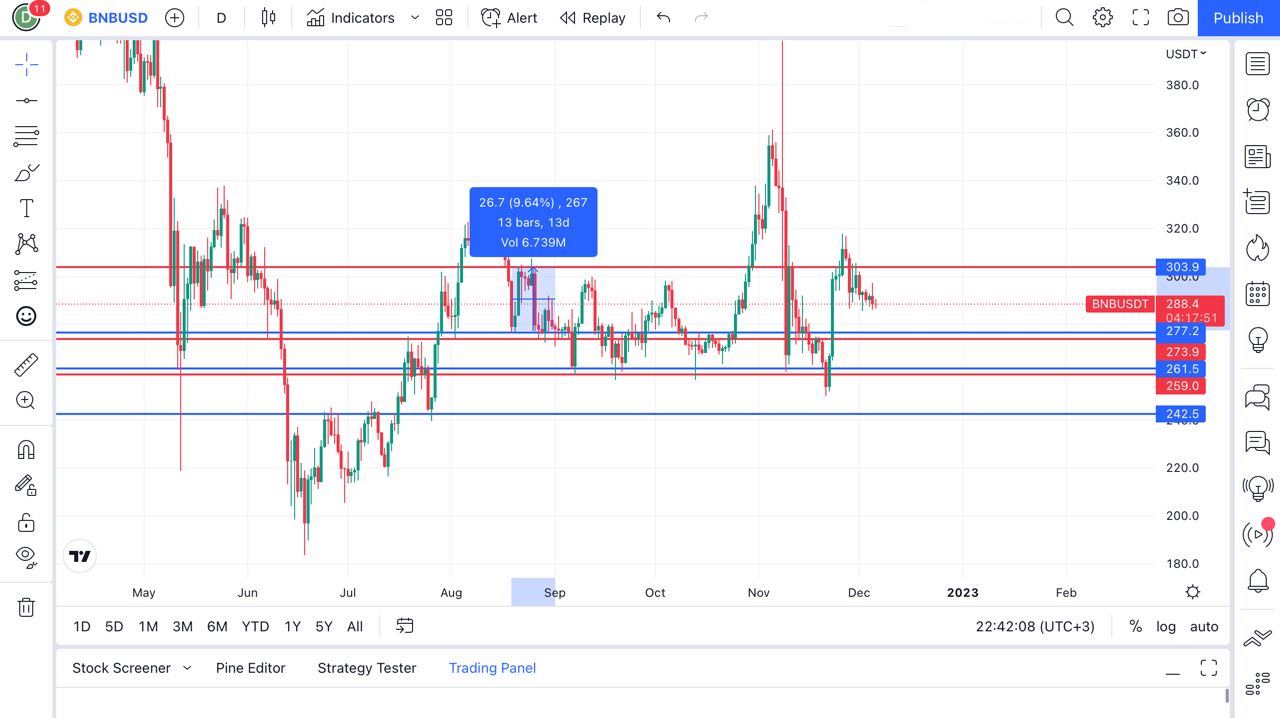
The 1st deal
When opening a trade at the upper blue line (277.2) we take the profit on the upper red line (303.9). In this case we will get about 9% (the range is marked on the chart). It means that the price increased from the upper blue line to the upper red line, and that increase was 9%.
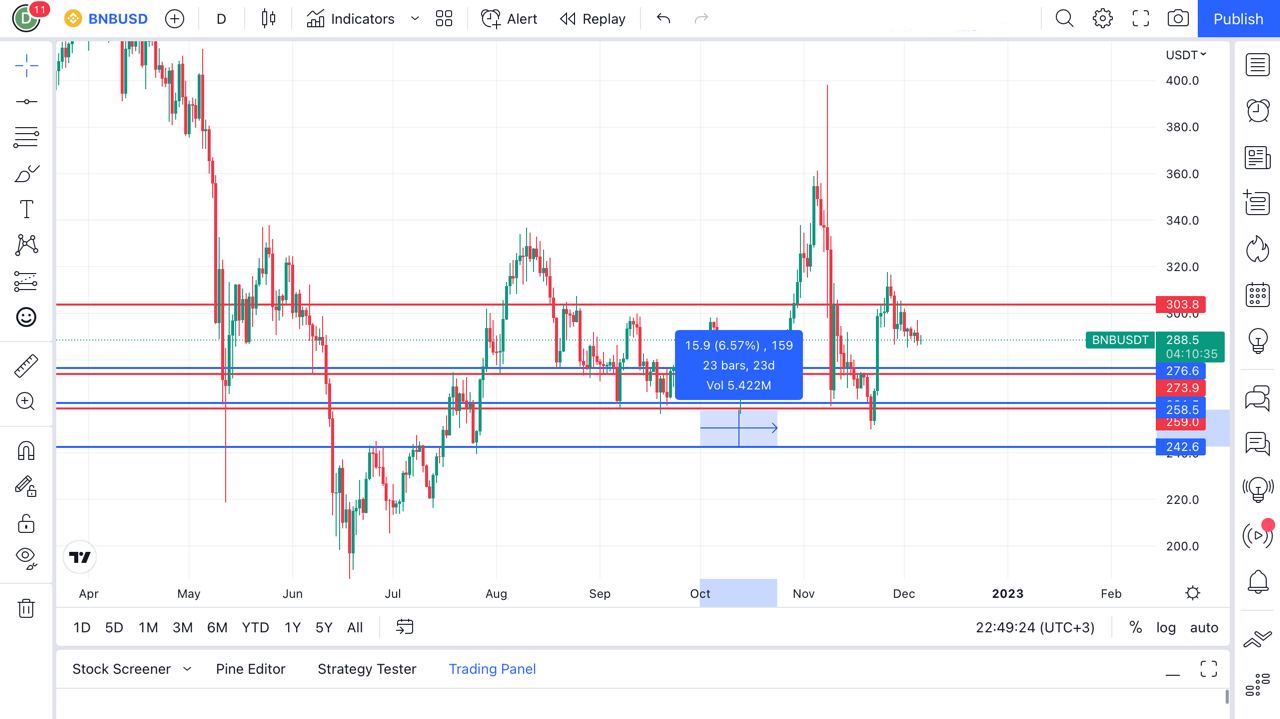
The 2nd deal
If the price of the first trade continues to drop, we wait for the second trade to open at the middle blue line (261.5). We take profit for the second trade when the price reaches the middle red line (273.9), and there we take a small loss on the first trade. So for the second deal we will have a 4.5% profit, and for the first one there is a small loss of 0.8%. The final result will already be a profit.

The 3rd deal
In case the price drops below the upper and middle blue lines, we wait for the opening of the third trade at the lower blue line (242.6). There we take profit at the level of the lower red line (259). And there we also take the losses on the first and second deals. As a result, the profit on the third trade may be 6.5%, the loss on the second trade is 1%, and 6.73% on the first. Here we also end up with profit as the coin rate will grow.
In our example, the price did not reach the lower blue line. More often traders take profits on the first and second deals.
If the price falls to the bottom blue line and beyond, we stick to the third option (allocate 8% of our total capital to buy coins), as we are investing in coins that are guaranteed to grow in the future.
So that’s it, such a conservative but quite profitable strategy allowing both experienced traders and newbies to earn.
Conclusion
We learned all the advantages of the crypto-trader profession, learned the basic principles of analyzing coins on the chart and mastered quite a profitable Ladder strategy. In order to succeed in cryptocurrency trading and get stability in the future, you need to practice all the time. It is better not to scatter your attention on hundreds of strategies, but find 2-3 ones you like and start testing them. Over time, you will explore them fully and will be able to supplement them with innovations. This is how your individual trading strategy will be formed.
💌 Subscribe to our social networks (Telegram, Instagram, Twitter, FB) so as not to miss new articles!
This article is not an investment recommendation. The financial and other transactions mentioned in the article are not a guide to action. Itez is not responsible for possible risks. The user should independently conduct an analysis on the basis of which it will be possible to draw conclusions and make decisions about conducting any operations with cryptocurrency and / or tokens.