Mastering the nuances of trading requires a deep understanding of various price action patterns and their implications. Among these, the concepts of lower highs and higher lows play a crucial role in identifying trend reversals and shaping effective trading strategies. This comprehensive guide delves into these patterns, providing traders with the knowledge and tools necessary to enhance their technical analysis skills.
Introduction to price action analysis
Price action analysis forms the bedrock of technical analysis, focusing on historical price movements to predict future trends. By examining patterns and swings in the market, traders can make informed decisions based on the behaviour of price, without relying heavily on lagging indicators.
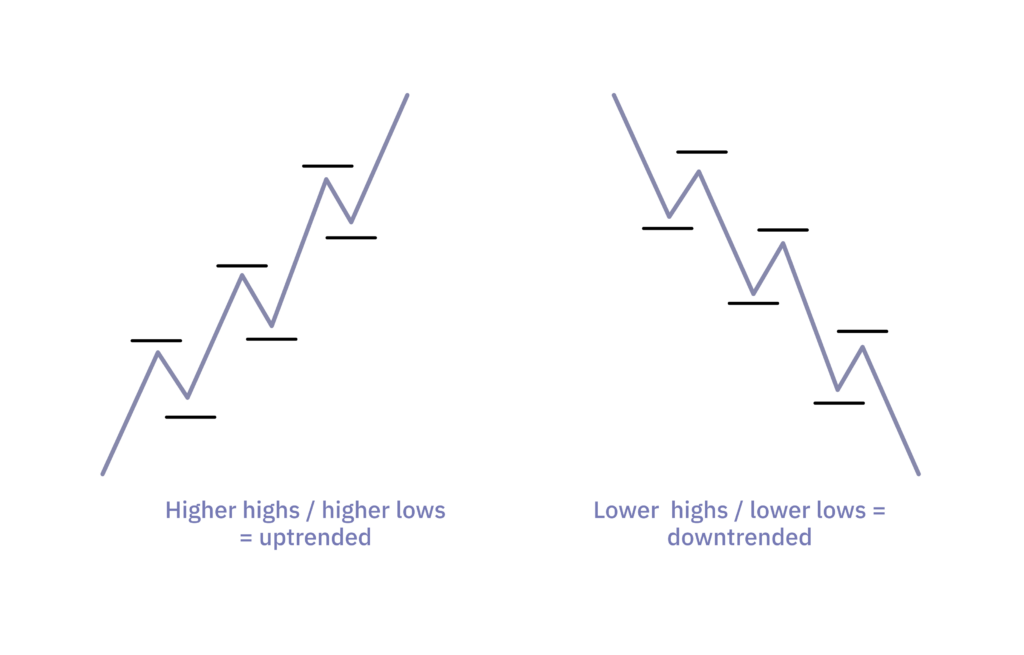
Defining lower highs and higher lows. Lower highs and higher lows are fundamental concepts in price action analysis. A lower high occurs when the price peaks at a level lower than the previous high, suggesting a weakening upward momentum. Conversely, a higher low is observed when the price troughs at a level higher than the previous low, indicating a strengthening upward momentum.
Significance of price swings in technical analysis. Price swings, defined by their peaks and troughs, are critical in understanding market sentiment and momentum. Lower highs and higher lows can signal potential trend reversals, offering traders valuable insights into future price movements. Recognising these patterns can help traders identify when a prevailing trend might be losing strength or when a new trend is emerging.
Identifying trend reversals
Identifying trend reversals is a key aspect of successful trading. Patterns such as lower highs and higher lows are essential in this process, as they provide early signals of potential changes in market direction. Additionally, understanding higher highs and lower lows can further enhance a trader's ability to predict reversals.
Recognising lower highs as potential reversal signals. Lower highs can serve as early indicators of a trend reversal from bullish to bearish. When a series of lower highs is observed, it suggests that buyers are losing strength, and sellers are gaining control. This pattern often precedes a downtrend, making it a crucial signal for traders to watch.
Understanding higher lows in trend reversals. Higher lows indicate a potential reversal from bearish to bullish trends. This pattern shows that sellers are losing momentum, and buyers are stepping in at higher price points. Recognising higher lows helps traders anticipate the beginning of an uptrend, allowing them to position themselves accordingly.
Identifying higher highs and lower lows. Higher highs and lower lows are also significant in trend identification techniques. Higher highs occur when the price reaches a peak higher than the previous peak, suggesting strong bullish momentum. Conversely, lower lows are seen when the price drops to a trough lower than the previous trough, indicating strong bearish momentum. Both patterns are essential in determining the strength and direction of a trend.
Using lower highs and higher lows in trading strategies
Incorporating lower highs and higher lows into trading strategies can enhance a trader's ability to predict and respond to market movements. These patterns can be applied in various trading techniques, including swing trading and trend following.
Swing trading strategies based on price action. Swing trading involves capturing short to medium-term gains by trading within a larger trend that can last for months. Lower highs and higher lows are particularly useful in swing trading, as they help identify optimal entry and exit points. For example, traders might short a security when a lower high is confirmed or go long when a higher low is established.
Swing trading strategies often rely heavily on identifying support and resistance levels. When a trader observes lower highs forming near a known resistance level, it can reinforce the signal to short the asset. Similarly, higher lows forming near a support level can provide a stronger signal to go long. Combining these patterns with other indicators, such as moving averages or RSI (Relative Strength Index), can increase the accuracy of trade entries and exits.
Incorporating lower highs and higher lows into your analysis. To effectively incorporate lower highs and higher lows into analysis, traders should combine these patterns with other technical tools, such as support and resistance levels, candlestick patterns, and market momentum indicators. This comprehensive approach enhances the accuracy of predictions and improves overall trading performance.
For instance, recognising a series of lower highs in conjunction with bearish candlestick patterns, like the engulfing pattern, can provide a more robust signal of an impending downtrend. On the other hand, higher lows supported by bullish candlestick patterns, such as the hammer (bullish reversal pattern that forms after a downtrend, characterized by a small body and a long lower wick, signaling potential buying pressure) or the morning star (bullish reversal pattern consisting of three candlesticks: a long bearish candle, a small-bodied candle (which can be bullish or bearish), and a long bullish candle, indicating a potential trend reversal to the upside), can indicate a strong potential for an upward reversal.
Utilising trend reversal patterns and chart patterns. Trend reversal patterns and chart patterns play a critical role in confirming signals derived from lower highs and higher lows. Patterns like head and shoulders, double tops, and double bottoms can provide additional confirmation of trend reversals. Chart patterns, such as triangles and flags, can also highlight consolidation phases that may precede significant price movements.
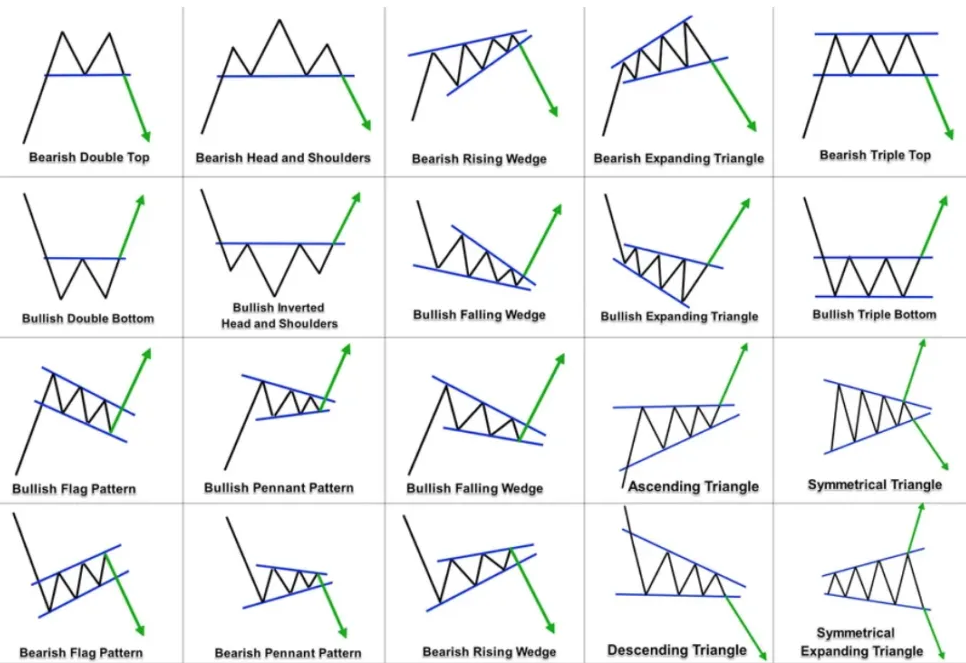
Trend patterns and chart patterns
Practical examples and case studies
Examining real market examples and case studies provides practical insights into how lower highs and higher lows can be used effectively in trading.
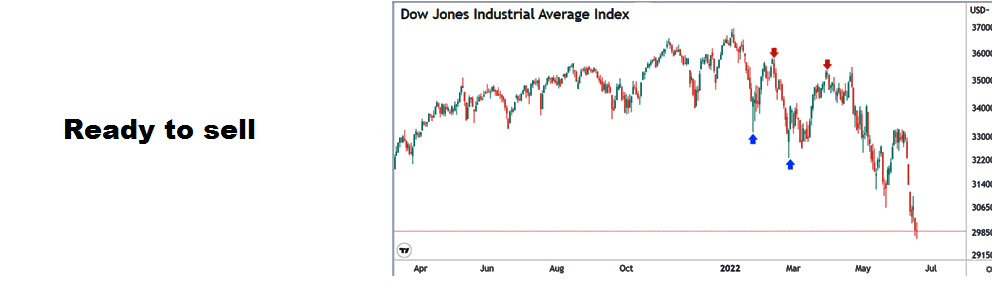
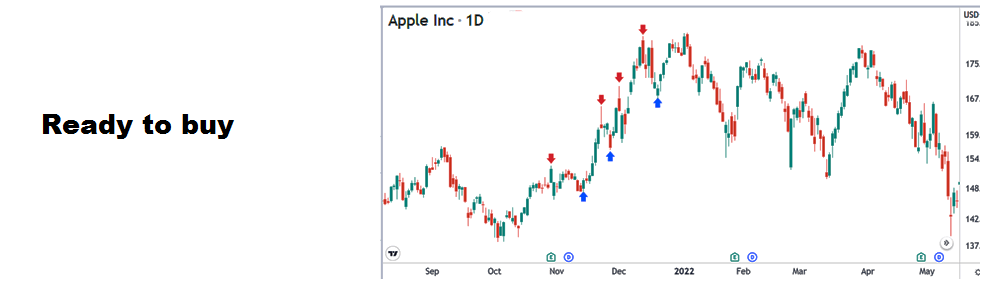
Analysing real market examples. Consider a scenario where a stock shows a series of lower highs over several trading sessions. This pattern indicates that the upward momentum is weakening, and a downtrend may be imminent. Traders observing this could prepare to short the stock, anticipating a decline in price.
In another example, suppose an asset is forming higher lows over a period of time. This pattern suggests increasing buyer interest at progressively higher price points, signalling potential for an upward breakout. Traders might look to enter long positions, with stop-losses placed just below the most recent higher low to manage risk.
Case study: trading lower highs and higher lows effectively. In a case study, let's examine a forex pair exhibiting higher lows over a period of weeks. This pattern suggests that the pair is poised for an upward breakout. A trader recognizing this trend might go long, setting a stop-loss just below the most recent higher low to manage risk effectively.
In another case, a stock shows lower highs coupled with declining volume, indicating weakening bullish momentum. A trader might short the stock, expecting a downward move. By placing stop-loss orders above the last lower high, the trader can protect against potential reversals, thus minimising risk.
Conclusion: mastering price action analysis
Mastering price action analysis, particularly the identification of lower highs and higher lows, is crucial for successful trading. These patterns provide early signals of trend reversals and can significantly enhance trading strategies. By combining these insights with other technical analysis tools, such as trading indicators, news analysis, sentiment data research, traders can develop a robust approach to navigating the markets.
Understanding and applying the concepts of lower highs and higher lows allows traders to stay ahead of market movements, making more informed and timely decisions. This knowledge, when coupled with continuous learning and practice, forms the foundation for long-term trading success.
Additional resources for further learning
To deepen your understanding of lower highs and higher lows, and other price action patterns, consider exploring the following resources:
- Books on technical analysis and price action trading. Here are some examples: Technical Analysis of the Financial Markets by John J. Murphy and Japanese Candlestick Charting Techniques by Steve Nison.
- Online courses and webinars focused on advanced trading techniques. For example, you can take lessons by notorious trader Peter Brandt or popular analyst and founder MN Consultancy Michaël van de Poppe.
- Trading forums and communities where experienced traders share insights and strategies. The basis: Reddit and elitetrader.
By continually learning and applying these concepts, traders can improve their analytical skills and increase their chances of success in the markets. Engaging with a community of traders and participating in discussions can also provide valuable real-time insights and feedback, further enhancing your trading acumen.
This comprehensive understanding of lower highs and higher lows, along with practical application and continuous learning, equips traders with the tools necessary to navigate the complexities of the market effectively.
🤔 What do you think about shorting Bitcoin? Share your views in our socials!
💌 Telegram, Twitter, Instagram, Facebook
Here are three other cool articles:
How to short Bitcoin: a comprehensive guide
What the repayment of Mt. Gox debts means for Bitcoin and the entire market
How MiCA will change the whole crypto industry
This article is not investment advice or a recommendation to purchase any specific product or service. The financial transactions mentioned in the article are not a guide to action. It’s not intended to constitute a comprehensive statement of all possible risks. You should independently conduct an analysis on the basis of which it will be possible to draw conclusions and make decisions about making any operations with cryptocurrency.