Candlestick patterns are one of the most powerful tools in a trader's technical analysis toolkit. Originating from Japan, these patterns provide critical insights into market sentiment and can significantly improve trading decisions. Whether you are trading traditional assets like stocks or more volatile assets like Bitcoin (BTC), understanding how to read and use trading candlestick patterns is key to making informed decisions. Candlestick patterns are used by professional and retail traders alike, and their flexibility makes them suitable for various assets and timeframes. This guide will cover everything from basic types of candle patterns to advanced strategies and explain how these patterns can be used in live trading situations.
By the end of this article, you will understand how trading candlestick patterns work, how to apply them in both traditional and cryptocurrency markets, and how to use different candlesticks to enhance your trading strategy.
Introduction to candlestick patterns
Candlestick patterns visually represent price movements over a certain period, offering traders an intuitive way to analyse market sentiment. Each candlestick conveys four pieces of data: the opening price, closing price, highest price, and lowest price. These data points form the building blocks for types of candle patterns that signal potential market trends or reversals.
The beauty of candlestick charts is their simplicity; they provide complex data in a format that is easy to read and interpret. This is why traders across all asset classes — from stocks to cryptocurrencies — rely on candlestick trends to identify market opportunities.
The origin of candlestick charting
Candlestick charts have a rich history dating back to the 18th century in Japan, where they were used to track the price of rice. A trader named Munehisa Homma developed this method, recognizing that market sentiment and psychology played a significant role in price movements. His insights allowed him to predict future price trends with high accuracy, earning him a fortune.
Today, candlestick charts are a global standard for analysing financial markets, from traditional equities to cryptocurrency. These charts offer not only a way to track price movements but also to understand the emotional undercurrents of the market, whether bullish or bearish.
Why candlestick patterns matter in trading
Candlestick patterns are invaluable because they provide insight into market sentiment. They help traders decide whether the market is bullish (dominated by buyers) or bearish (dominated by sellers), allowing them to make better-informed decisions about when to enter or exit trades. For example, when a bullish pattern forms after a downtrend, it may signal that the market is ready to reverse upward, prompting traders to enter long positions.
Trading candlestick patterns become even more effective when combined with other forms of technical analysis, such as moving averages or volume trading. By confirming price action with other indicators, traders can reduce the risk of false signals and make more confident decisions.
Moreover, understanding candlestick trends allows traders to gain a deeper understanding of market trends, whether short-term or long-term. It equips traders to make real-time decisions, especially during volatile market conditions.
Understanding basic candlestick patterns
To build a strong foundation in candlestick trading, it’s essential to understand the basic types of candle patterns. These simple yet powerful patterns can help predict market reversals and continuations with a reasonable degree of accuracy.
The anatomy of a candlestick
Each candlestick consists of a body and wicks (or shadows). The body represents the range between the opening and closing prices, while the wicks show the highest and lowest prices reached during the period. The colour of the body indicates whether the market closed higher (bullish) or lower (bearish) than it opened.
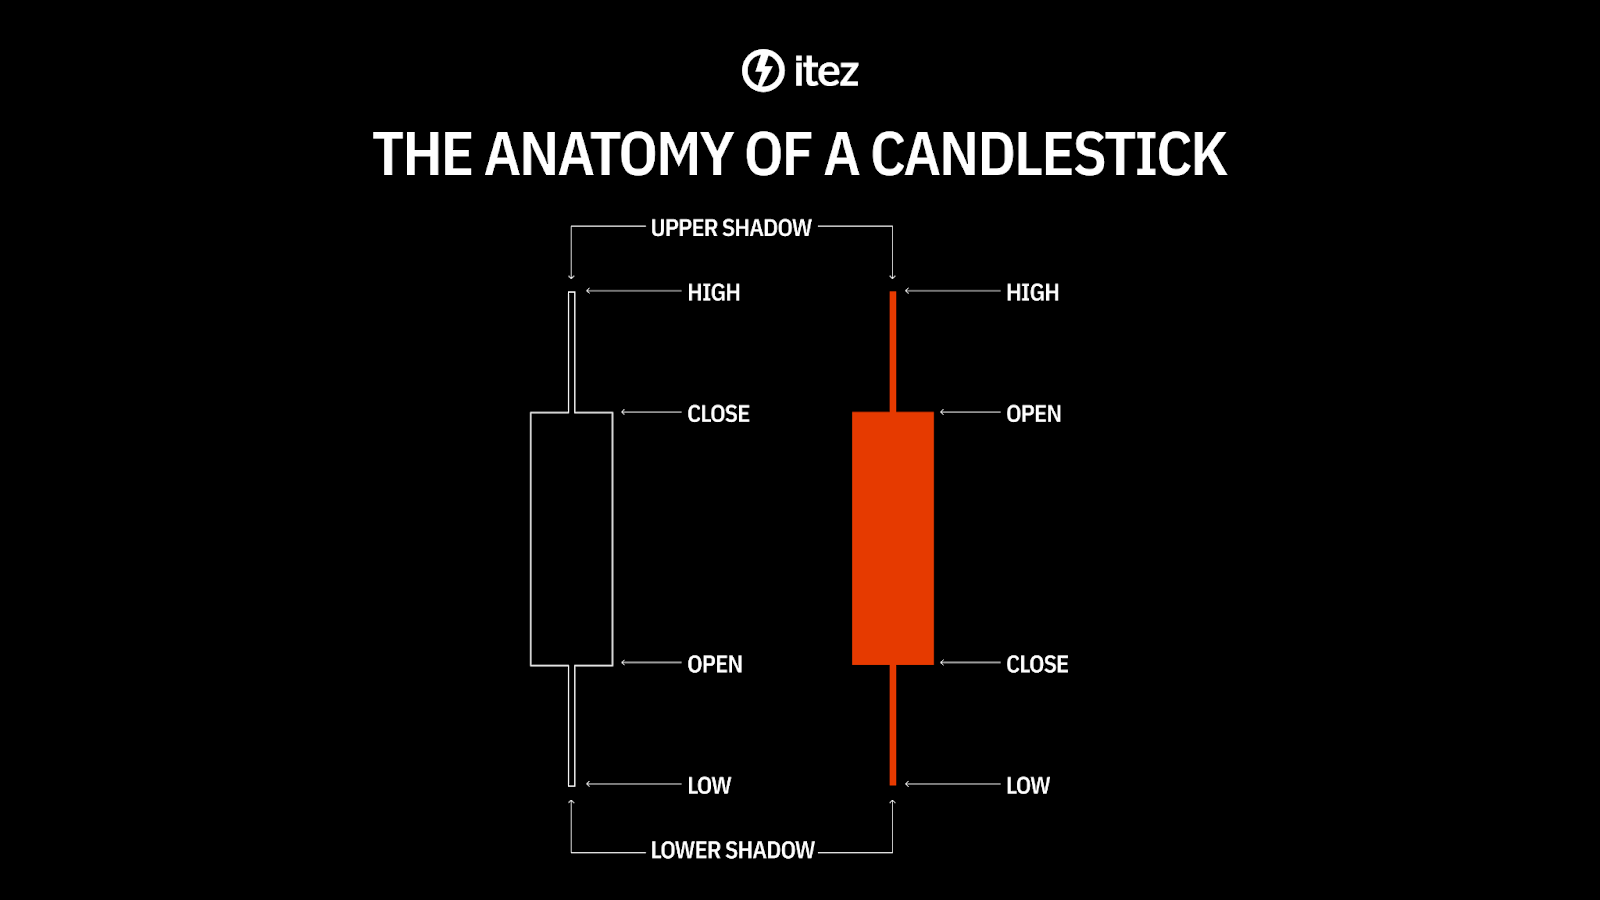
Understanding the anatomy of a candlestick is crucial because it allows traders to quickly assess market sentiment. For example, a long bullish candlestick with little to no lower wick indicates that buyers dominated the market, pushing the price up throughout the entire session.
Common candlestick patterns and their interpretations
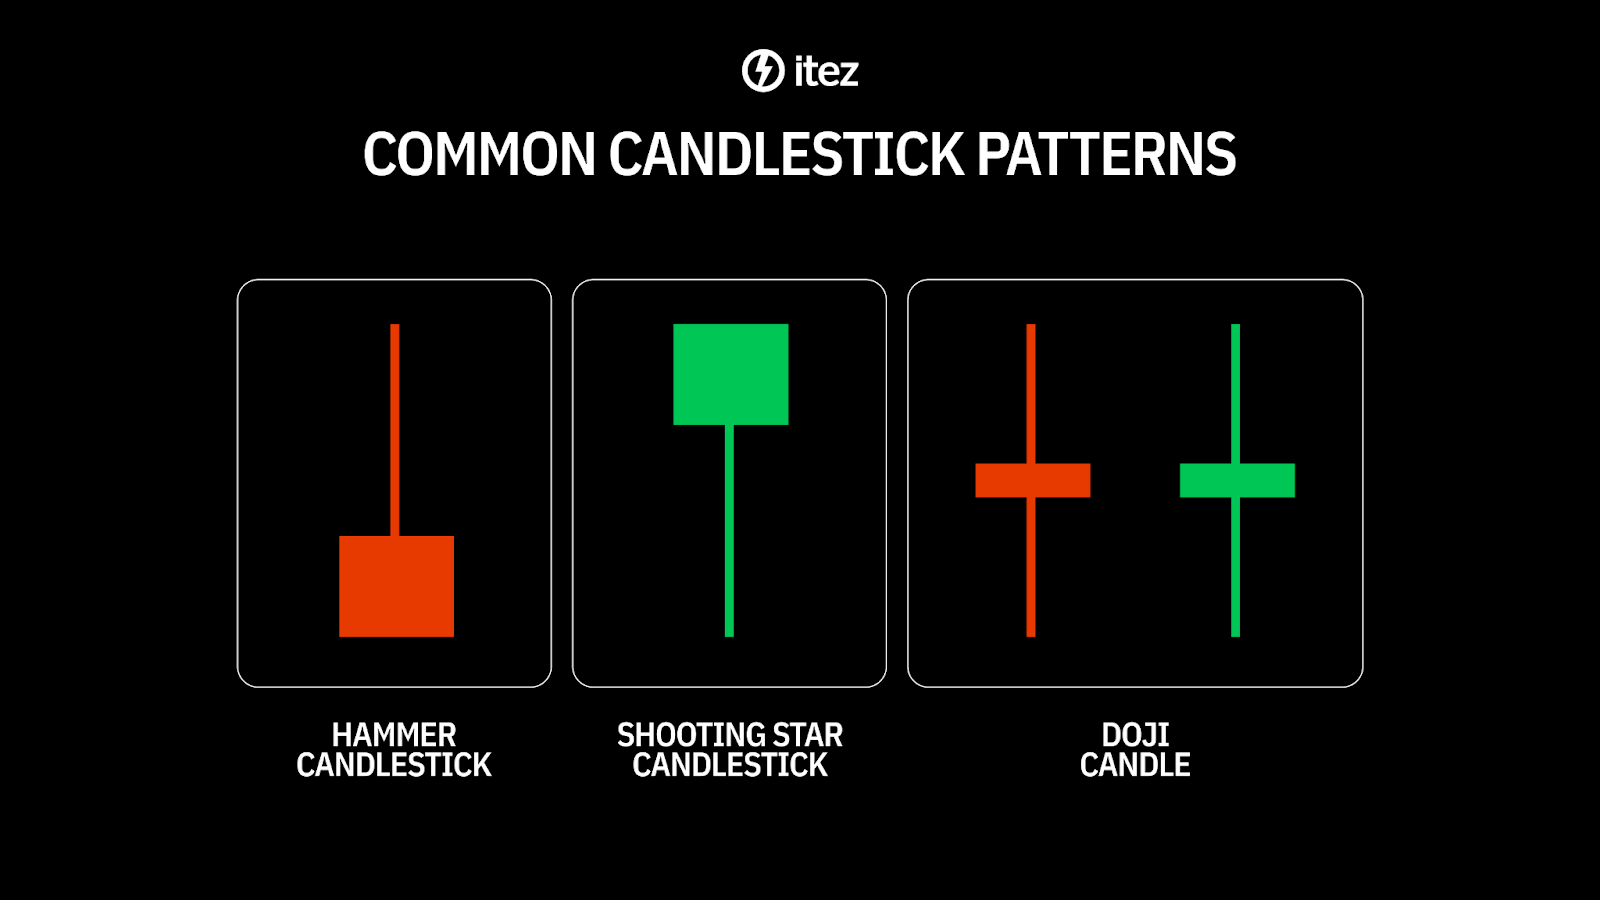
Among the most basic yet widely recognized patterns are the doji, hammer, and shooting star. Each pattern signals different market conditions:
- Doji. When the opening and closing prices are almost identical, forming a "cross". A doji signifies indecision in the market. Depending on its position in a trend, a doji can signal a reversal or continuation.
- Hammer. This bullish reversal pattern forms after a downtrend, characterised by a small body and a long lower wick. It shows that sellers initially controlled the market, but buyers stepped in, driving the price back up.
- Shooting star. A bearish reversal pattern that forms after an uptrend. The price rises significantly during the session but pulls back to close near the opening, suggesting that buyers were overwhelmed by sellers.
These basic types of candle patterns provide traders with initial signals of potential trend reversals. When combined with other indicators, such as volume or moving averages, they become powerful tools for making trading decisions.
Advanced candlestick patterns for trading
Once you understand the basics, you can move on to more complex patterns, which offer deeper insights into market dynamics and provide stronger signals for trend reversals or continuations.
Complex candlestick formations
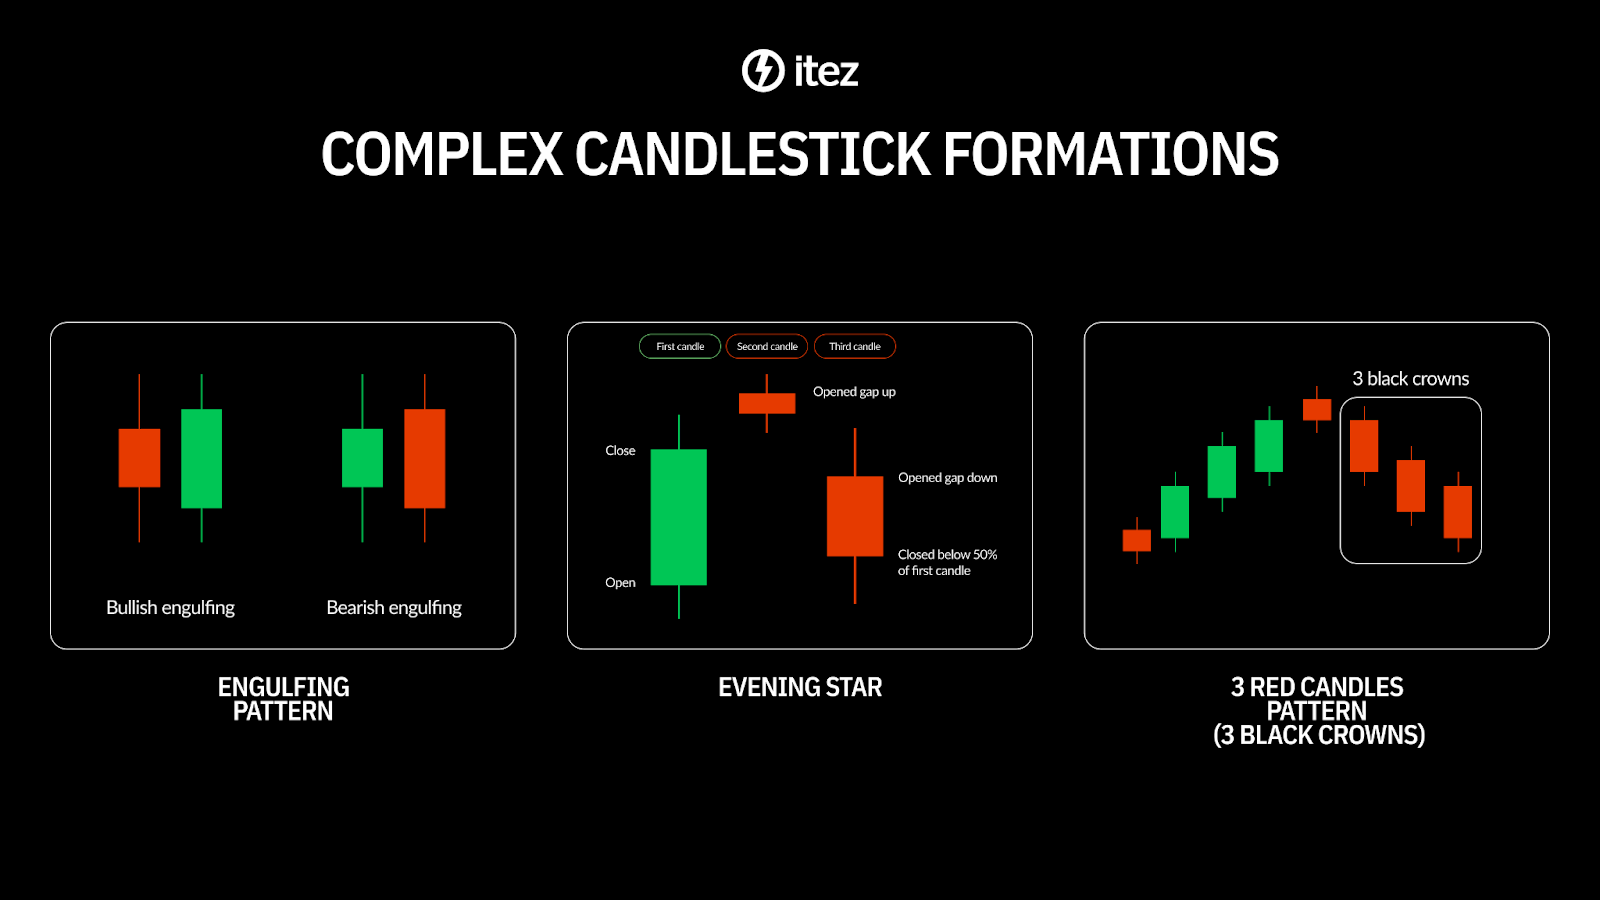
Advanced traders often look for multi-candlestick patterns like the engulfing pattern, evening star, and 3 red candles pattern to predict market movements with greater accuracy.
- Engulfing pattern. A reversal pattern in which a smaller candlestick is followed by a larger one that "engulfs" it. A bullish engulfing pattern after a downtrend signals a potential upward reversal, while a bearish engulfing pattern at the top of an uptrend signals a reversal downward.
- Evening star. A bearish reversal pattern that occurs at the end of an uptrend, consisting of three candlesticks: a large bullish candle, a small indecisive candle, and a large bearish candle. It indicates that the uptrend is losing momentum and that a downtrend may follow.
- 3 red candles pattern (3 black crowns). This pattern consists of three consecutive long bearish candles, indicating strong selling pressure. It is often a sign of an ongoing downtrend and suggests that the bearish sentiment is likely to continue.
Analysing patterns: doji, hammers, and shooting stars
Doji patterns often signal indecision in the market, but when combined with other indicators, they can provide strong signals for reversals. For example, a gravestone doji appearing after an uptrend suggests that buyers are losing control and a reversal may be imminent.
The hammer and shooting star patterns are particularly useful for identifying price action trends. By recognising these patterns in candlestick chart live scenarios, traders can make more confident decisions in real-time market conditions.
Each of these patterns is a reflection of market sentiment and is most effective when used in conjunction with broader technical analysis techniques, such as volume trading or trendlines. Candlestick trading strategies often rely on these patterns to confirm broader market trends.
Applying candlestick patterns in live trading
Understanding patterns is one thing, but applying them in live market conditions is where the true skill lies. In live trading, candlestick patterns must be interpreted alongside other market data, such as volume, momentum, and overall trend direction.
Setting up a candlestick chart
Setting up a candlestick chart live is simple with the right trading platform. Platforms like TradingView and MetaTrader allow you to customise your charts with different timeframes, indicators, and overlays to suit your trading style.
When setting up a live candlestick chart, traders must ensure that they have all relevant data, including volume, moving averages, and trendlines. These additional layers help validate signals provided by trade candlestick patterns and reduce the likelihood of false signals.
Live candlestick chart analysis: a step-by-step guide
Analysing a live candlestick chart requires a systematic approach. Start by identifying the overall trend using larger timeframes (e.g., daily or weekly charts). Next, zoom into smaller time frames (e.g., 1-hour or 15-minute charts) to look for entry and exit points based on candlestick patterns.
For example, a bullish engulfing pattern on the 1-hour chart, combined with high volume, could indicate a strong buy signal, especially if the broader trend is bullish. Similarly, a 3 red candles pattern on the 15-minute chart in a downtrend suggests that further downward movement is likely.
By consistently applying trade candlestick patterns in live trading situations, traders can develop a disciplined approach to entering and exiting positions with higher confidence.
Candlestick patterns in cryptocurrency trading
Cryptocurrency trading is highly volatile, making trading candlestick patterns an essential tool for managing risk. Because cryptocurrencies like Bitcoin experience sharp and sudden price movements, candlestick analysis can help traders capitalise on short-term trends while managing long-term strategies.
The significance of Bitcoin candle charts
The Bitcoin candle chart is one of the most closely watched charts in cryptocurrency trading. Bitcoin’s price movements are often unpredictable, but candlestick patterns provide clues about market sentiment and potential reversals. Patterns like the doji and hammer are frequently seen in BTC trading and can signal important turning points in price action.
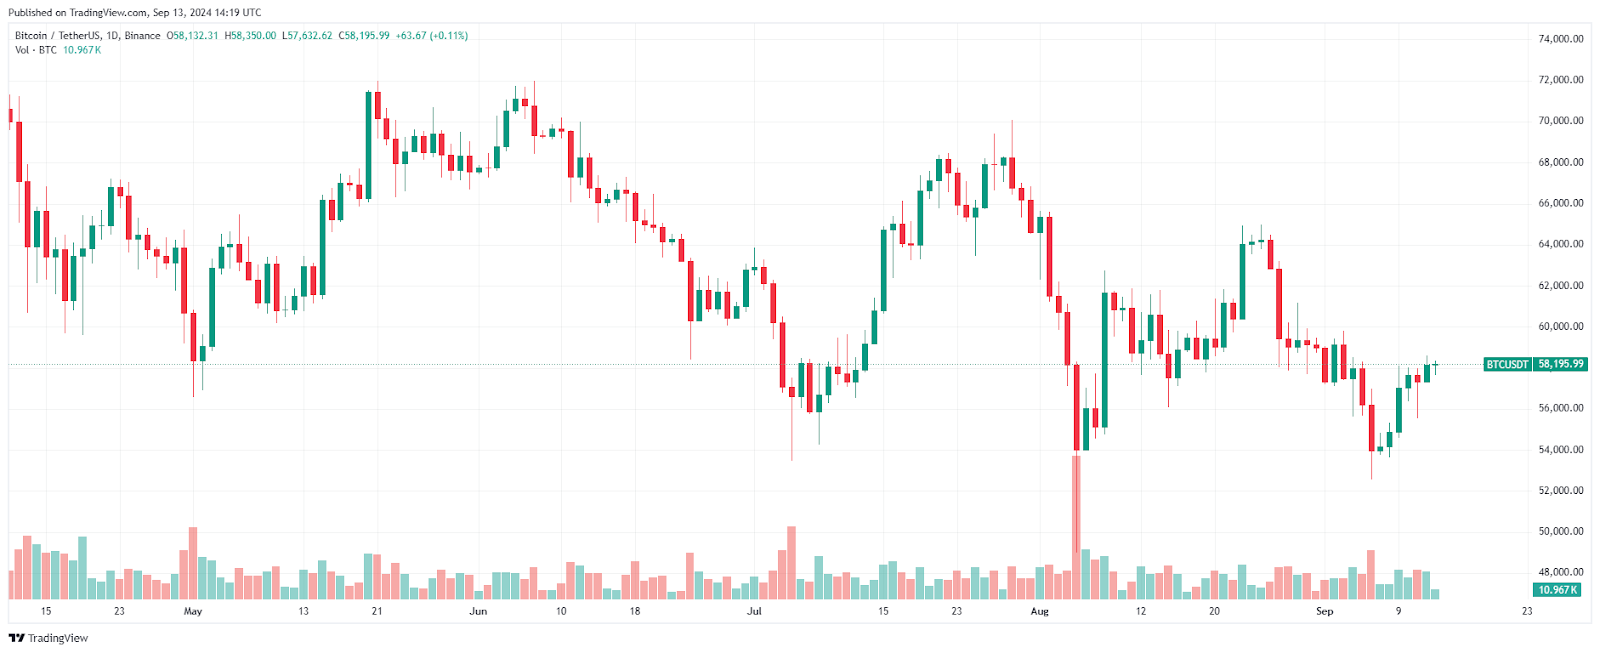
Bitcoin candlestick chart. Source: TradingView
By the way, using the itez widget, you can easily and securely buy Bitcoin and other cryptocurrencies.
Understanding candlestick patterns is especially important in the crypto market, where price movements can be extreme. For example, a sudden formation of a 3 red candles pattern in a Bitcoin candle chart may indicate a strong bearish trend that traders can take advantage of.
Case studies: successful trades using candlestick patterns
A trader analysing a Bitcoin candle chart during a period of high volatility in 2021 identified a bullish engulfing pattern. By confirming the pattern with rising volume, the trader entered a long position and captured a 15% gain within two days. This highlights the practical application of trading candlestick patterns in volatile markets.
Similarly, during a downtrend in Ethereum, another trader spotted a 3 red candles pattern and shorted the market, making a significant profit as the price continued to fall. These case studies demonstrate how candlestick trends can be applied in both up and down markets to generate consistent profits.
Conclusion and further learning
Mastering candlestick patterns is a vital skill for traders looking to improve their market analysis and trading strategy. Whether you are trading stocks, commodities, or cryptocurrencies, understanding both basic and advanced patterns gives you a competitive edge.
To enhance your understanding of candlestick trading, consider studying other technical analysis techniques such as Fibonacci retracements, moving averages, and volume trading. These tools, when combined with candlestick patterns, offer a comprehensive approach to analysing financial markets and making more informed decisions.
For those who want to deepen their expertise, exploring topics like market psychology and chart analysis will help you refine your trading approach and increase your chances of success.
🤔 What do you think about candlestick chart analysis? Share your views in our socials!
💌 Telegram, Twitter, Instagram, Facebook
Here are three other cool articles:
Mastering day trading crypto: A comprehensive guide
What is algo trading and how does it work? A comprehensive guide
This article is not investment advice or a recommendation to purchase any specific product or service. The financial transactions mentioned in the article are not a guide to action. It’s not intended to constitute a comprehensive statement of all possible risks. You should independently conduct an analysis on the basis of which it will be possible to draw conclusions and make decisions about making any operations with cryptocurrency.